Refer to the information provided in Figure 13.1 below to answer the question that follows.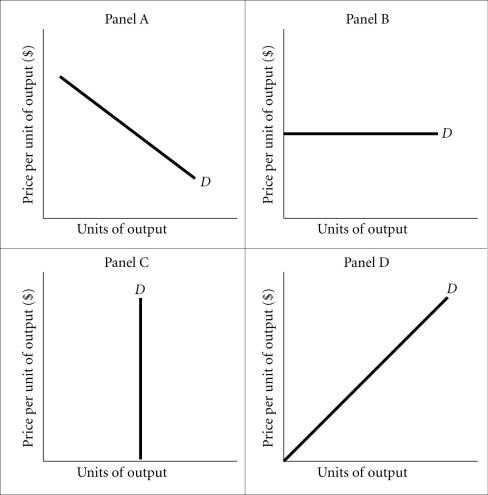 Figure 13.1Refer to Figure 13.1. Of the following choices, Panel A best represents the demand curve for
A. insulin.
B. a utility company.
C. an individual producer of soybeans.
D. none of the above
Answer: B
You might also like to view...
Results of research conducted regarding the Moving to Opportunity program found that the neighborhood you live in does matter, as it determines your destiny
Indicate whether the statement is true or false
The growth rate of real GDP per capita in Mexico was negative in which of the following time periods?
A) 1980-1989 B) 1990-1999 C) 2000-2014 D) all of the above
If the Fed wants to implement expansionary monetary policy, it might:
A. sell government securities to reduce the federal funds rate. B. buy government securities to increase the federal funds rate. C. buy government securities to reduce the federal funds rate. D. sell government securities to increase the federal funds rate.
The amount by which aggregate expenditures exceed those associated with the full- employment level of domestic output can best be described as:
A. A recessionary expenditure gap B. An inflationary expenditure gap C. The multiplier D. The average propensity to save