Solve the problem.The price per unit of a product is $p and the number of units of the product is denoted by q. The demand function for this commodity is given by p =  - 50. Describe the transformations needed to obtain the graph of this function from the graph of p =
  .
.
A. Stretch vertically by a factor of 20,000, reflect across the x-axis, and shift down 50 units.
B. Stretch vertically by a factor of 20,000 and shift 50 units to the right.
C. Stretch vertically by a factor of 20,000 and shift down 50 units.
D. Shift up 20,000 units and shift 50 units to the right.
Answer: C
You might also like to view...
Find the probability.The probability that Luis will pass his statistics test is 0.66. Find the probability that he will fail his statistics test.
A. 0.33 B. 1.52 C. 0.34 D. 1.94
Provide an appropriate response.Find the direction in which the function is increasing most rapidly at the point P0.f(x, y, z) = x , P0(1, 2, 1)
A. 

B. 

C. 

D. 

Rank the data from lowest to highest and determine the requested quartile.The following scores on the midterm exam in Chemistry 102 were recorded.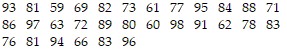 Find the 3rd quartile, Q3.
A. 88 B. 89 C. 75 D. 86
Draw and shade a Venn diagram that corresponds to the set.( ? B) ? C
A. 
B. 