Refer to the short-run production and cost data. In Figure A curve (1) is:
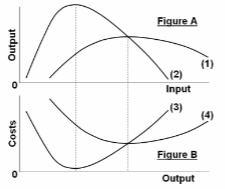
A. total product and curve (2) is average product.
B. total product and curve (2) is marginal product.
C. average product and curve (2) is marginal product.
D. marginal product and curve (2) is average product.
C. average product and curve (2) is marginal product.
You might also like to view...
A market in which a firm emerges as a monopoly due to large economies of scale is referred to as:
A) a natural monopoly. B) a regulated monopoly. C) a legal monopoly. D) an exclusive monopoly.
The figure above shows the market for coffee. The ________ price that producers must be offered to get them to produce 30 million pounds of coffee per month is ________
A) maximum; $2.50 B) minimum; $2.50 C) maximum; $4.00 D) minimum; $4.00
Suppose s = 0.14, Y = 4000, K = 6200, n = 0.02, and d = 0.08. In this case, national saving is ________ than steady-state investment, so that the amount of capital per worker is ________
A) greater, rising B) greater, falling C) less, rising D) less, falling
The objective of bank management is to
a. maximize stockholders' profits by making risky investments and giving loans to borrowers who will pay the highest interest rates. b. refuse to make risky loans and make loans only to the safest borrowers. c. invest in U.S. government securities and make loans only to established businesses. d. strike the appropriate balance between the attraction of bank profits and the need for bank safety.