Use the following graphs to answer the next question.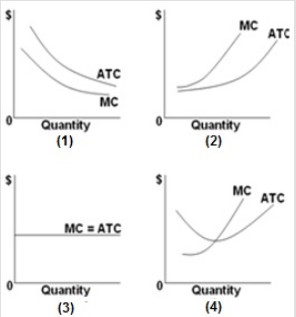 "The bigger the volume, the lower the cost, and we pass the savings on to you" is a familiar slogan. Its idea is illustrated in which of the above graphs?
A. Graph 1
B. Graph 2
C. Graph 3
D. Graph 4
Answer: A
You might also like to view...
Because women have a longer average life span than men, they pay
A) more for health insurance. B) less for health insurance. C) more for life insurance. D) less for life insurance.
A monopolist that charges different prices to different buyers based on their elasticizes of demand is practicing
a. first degree price discrimination. b. second degree price discrimination. c. third degree price discrimination. d. predatory pricing.
What is likely to happen to the labor market equilibrium for firemen as building codes change to require firewalls and sprinklers to be included in all new construction?
A. The number of firemen employed will increase while firemen wages will increase. B. The number of firemen employed will decrease while firemen wages will increase. C. The number of firemen employed will increase while firemen wages will decrease. D. The number of firemen employed will remain the same while firemen wages will increase. E. The number of firemen employed will decrease while firemen wages will decrease.
For this question, assume that the saving rate increases. We know that this increase in the saving rate will cause which of the following?
A) a temporary increase in the level of output per capita B) no permanent change in the level of output per capita C) a temporary increase in the rate of growth of output per capita D) a permanently higher rate of growth of output per capita E) none of the above