Refer to the figure below. Moving from demand curve D2 to demand curve D1 could be caused by a(n): 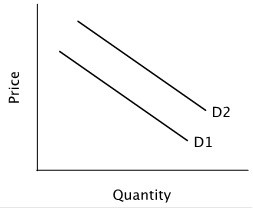
A. increase in the product's expected future price.
B. increase in quantity supplied.
C. increase in the price of a complement.
D. increase in the price of a substitute.
Answer: C
You might also like to view...
When crowding out occurs, interest rates typically
A. fluctuate. B. remain constant. C. decrease. D. increase.
Table 5-1B Number of coconuts 0 1 2 3 4 Robinson’s marginal utility C $2.00 $1.88 $1.60 $1.30 If a graph of Robinson’s marginal utility were constructed from Table 5-1B, it would
A. illustrate the “law” of diminishing marginal utility. B. be a negatively sloped curve. C. illustrate a typical consumer’s satisfaction derived from consumption of consecutive units of a good. D. All of the responses are correct.
A key issue in the presidential election of 2012 between President Obama and Mr. Romney concerned tax rates. President Obama favored increasing taxes, especially on the rich. As a result of a tax increase
A) the aggregate demand curve shifts leftward. B) the aggregate demand curve shifts rightward. C) the aggregate supply curve shifts leftward. D) the aggregate supply curve shifts rightward.
Which of these would NOT be considered a middleman in a market?
A) a produce wholesaler B) an apple farmer C) a smartphone retailer D) a fruit distributor