Solve the problem.The one-day temperatures for 12 world cities along with their latitudes are shown in the table below. Make a scatter diagram for the data. Then find the line of best fit and graph it on the scatter diagram.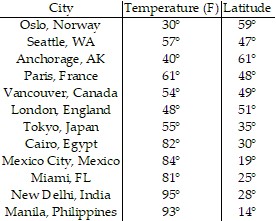 Latitude (degrees)
 Temperature (F)°
What will be an ideal response?
Latitude (degrees)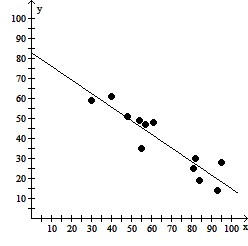
Temperature (F)°
Line of best fit = -0.68x + 82.91
Mathematics
You might also like to view...
Find the equation for the plane tangent to the parametrized surface S at the point P.S is the paraboloid r(?, r) = r cos ?i + r sin ?j + 6r2k ; P is the point corresponding to  .
.
What will be an ideal response?
Mathematics
The given point is on the graph of y = f(x). Find a point on the graph of y = g(x).g(x) = 4f(x); (2, 4)
A. (5, 3) B. (2, 16) C. (8, 4) D. (3, 8)
Mathematics
Classify the polygon by name. If it is a quadrilateral, give its specific name.
A. Pentagon B. Rhombus C. Trapezoid D. Rectangle
Mathematics
Solve the problem.Determine the point on the paraboloid  that is closest to the point
A. (3, 2, 84) B. (2, 3, 59) C. (-2, 3, 59) D. (3, -2, 84)
Mathematics