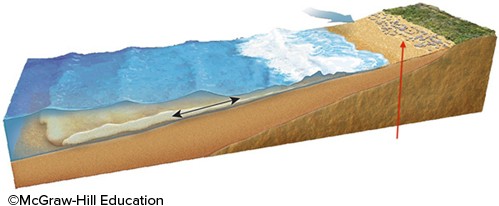
The diagram below represents a model that the U.S. Geological Survey (USGS) uses to categorize the extent of storm surge in the coastal zone. The red arrow in this figure points to
A. the height of high tide.
B. the radius of motion of water molecules that are part of the waves of oscillation.
C. the maximum height of the swash zone.
D. the highest rate of discharge from the nearest stream.
Answer: C
You might also like to view...
Tianjin lies in the ________ industrial region of China
A) Hong Kong B) Sony C) Bohai Rim D) Minnan Delta
The geothermal gradient for a volcanic region is greater than that for the continental interior.
Answer the following statement true (T) or false (F)
Services is also known as the ________ sector of the economy
Fill in the blank(s) with correct word
what kinds of molecular comparisons are useful for determining species relatedness
a. whole genome comparisons b. single gene sequence comparisons c. genetic code variation d. the protein cytochrome c e. amino acid sequence of a common protein