The following table shows the study time for a particular chapter in a calculus class and the corresponding test grade for that chapter.
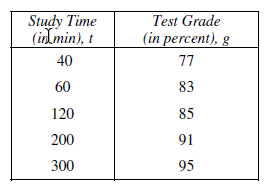
a) Using the data points (60, 83) and (300, 95) to find a linear function that fits the data.
(b) Use the linear function to predict the test grade for a student who studies 240 min.
(a) g = 0.05t + 80
(b) 92
You might also like to view...
Graph the parabola.y2 = 20x 
A. 
B. 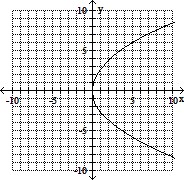
C. 
D. 
Write the partial fraction decomposition of the rational expression.
A.  +
+ 
B.  +
+ 
C.  +
+ 
D.  +
+ 
Frequency distribution of the scores from a mathematics test is given in the table below. Find the sample standard deviation. IntervalMidpoint xFrequency fProduct xf64.5 - 70.5 4 70.5 - 76.5 7 76.5 - 82.5 7 82.5 - 88.5 5 88.5 - 94.5 2 94.5 - 100.5 6 Round your answer to the nearest whole number.
A. 12 B. 10 C. 18 D. 17 E. 8
Translate to a proportion and solve. When necessary, round to the nearest hundredth.What is 8.0% of 38?
A. 30.4 B. 304 C. 0.3 D. 3.04