Graph the following function by transforming the given graph of y = f(x).Sketch the graph of y = f(x - 3).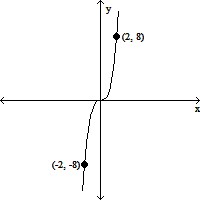

A. 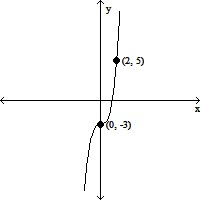
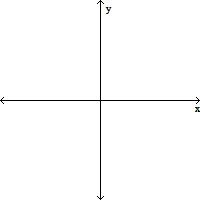
B. 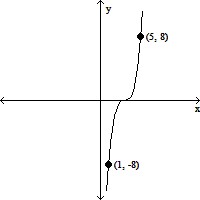
C. 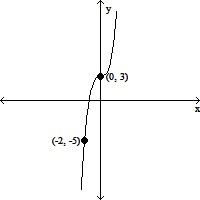
D. 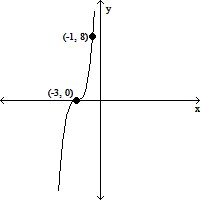
Answer: B
Mathematics
You might also like to view...
Solve the problem.One approximate formula for population growth is  , where T is the number of years for the population to double. According to this formula, how long does it take for the population to double?
A. 39.8 years B. 4.4 years C. 55.2 years D. 27.6 years
Mathematics
Use Euler's formula to answer the question.A polyhedron has 15 vertices and 20 faces. How many edges does it have?
A. 34 B. 37 C. 35 D. 33
Mathematics
Solve.A city has been growing at a rate of 0.3% annually. If there are currently 3,949,000 residents in the city, how many (to the nearest ten-thousand) would be living in this city eight years from now? Use  .
.
A. 10,660,000 B. 4,040,000 C. 260,000 D. 4,070,000
Mathematics
Graph the function.f(t) = -3 sin (t) 
A. 
B. 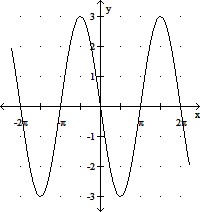
C. 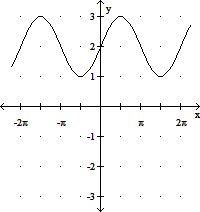
D. 
Mathematics