The shipment times in hours for a load of goods from a factory to market are tabulated in the frequency distribution in the table below. Draw a histogram for the data displayed.
Shipment time (hours) Frequencyf22.5 - 27.5 227.5 - 32.5 3932.5 - 37.5 7037.5 - 42.5 3342.5 - 47.5 1647.5 - 52.5 8
A. 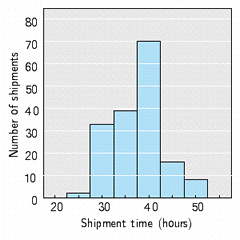
B. 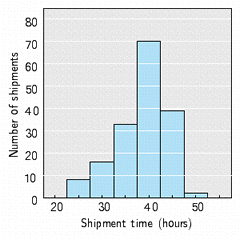
C. 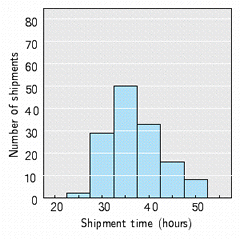
D. 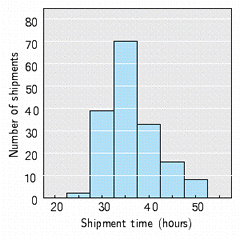
E. 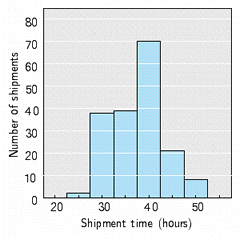
Answer: D
You might also like to view...
A farmer wishes to work out the average milk yield in his herd that consists of an equal number of Ayrshire, Friesian, Galloway, and Jersey cows.Suppose the farmer selects the first 3 cows of each type that he milks to be in his sample. What type of sampling is being used?
A. capture-recapture B. stratified sampling C. quota sampling D. convenience sampling E. simple random sampling
Answer the following statement(s) true (T) or false (F)
It is possible for a function to be both decreasing and concave up on the same interval.
Factor the four-term polynomial by grouping.xy + 11x - 8y - 88
A. (x - 11)(y + 8) B. (y + 11)(x - 8) C. (y - 11)(x + 8) D. (x + 11)(y - 8)
Write the decimal as a fraction or mixed number in lowest terms.0.5
A. 
B. 
C. 
D. 