The pie chart below shows the number of pizzas consumed by college students in a typical month. Use the chart to answer the question. 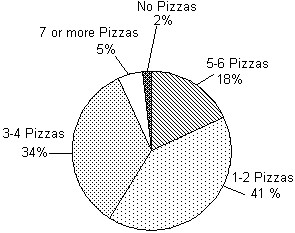 What percent of college students consume no pizzas in a typical month?
A. 5%
B. 34%
C. 2%
D. 18%
Answer: C
Mathematics
You might also like to view...
Perform the operation indicated. Simplify. -
- 
A. 
B. 
C. 
D. 
Mathematics
Find the requested value.Using the given tables, find (g?f) (2)

A. 2 B. 3 C. 7 D. 5
Mathematics
Solve by using the quadratic formula.x2 + 18x + 71 = 0
A. 9 ± 
B. -18 + 
C. -9 ± 
D. 9 + 
Mathematics
Evaluate the expression using exponential rules. Write the result in standard notation.(6 × 10⁻³)(2 × 10⁻²)
A. 0.00012 B. 0.0012 C. 0.000012 D. 0.0000012
Mathematics