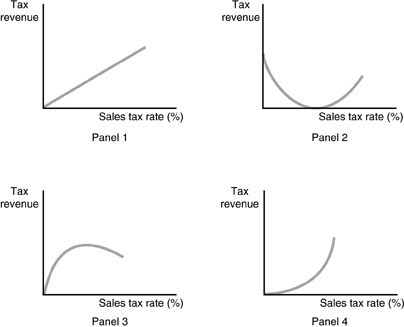
 Refer to the above figures. Which panel represents the expected relationship between tax revenue and the sales tax rate if dynamic tax analysis is used?
A. Panel 1
B. Panel 2
C. Panel 3
D. Panel 4
Answer: C
You might also like to view...
Suppose there is a decline in the demand for the product labor is producing. Furthermore, the price of capital, which is complementary to labor, increases. Thus, the demand for labor
A. will decrease. B. will increase. C. may either increase or decrease. D. will not change.
A shortage occurs in a market when:
A) supply exceeds demand. B) price is lower than the equilibrium price. C) price is higher than the equilibrium price. D) the marginal utility of consumption is negligible.
Explain how an import quota might be more inefficient than an import tariff that has the same impact on prices.
What will be an ideal response?
Refer to the following graph. At which of the following prices will the firm be losing money but should remain in operation?
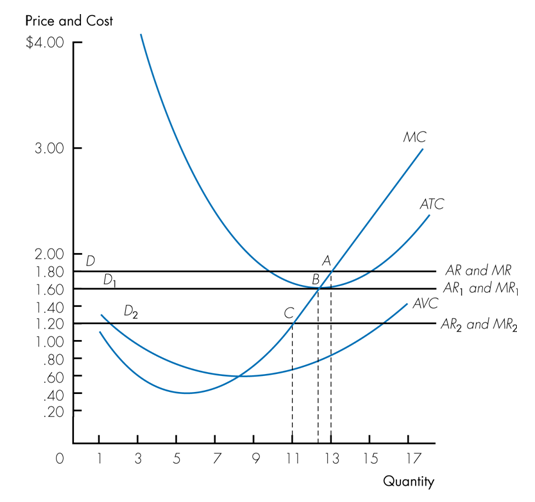
a. $1.80
b. $1.60
c. $1.20
d. $0.40