Refer to the information provided in Figure 26.2 below to answer the question(s) that follow.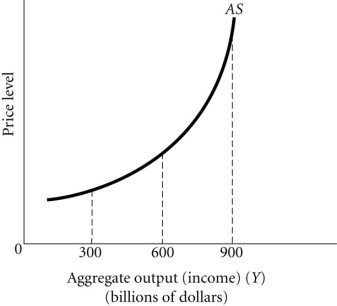 Figure 26.2Refer to Figure 26.2. Between the output levels of $300 billion and $600 billion, the relationship between the price level and output is
A. positive.
B. negative.
C. constant.
D. There is no relationship between the price level and output.
Answer: A
You might also like to view...
Suppose Warren Buffet withdraws $1 million from his checking account at Chase Bank. If the required reserve ratio is 20 percent, what is the maximum change in deposits in the banking system?
A) -$5 million B) -$4 million C) -$200,000 D) $1 million E) $5 million
Which of the following is NOT a characteristic or focus of microeconomics?
A) individual consumers. B) analysis of aggregate economic variables C) firm behavior D) individual markets
Per capita GDP will definitely fall when
A. Population increases. B. The labor force decreases. C. The population growth rate exceeds the economic growth rate. D. GDP decreases.
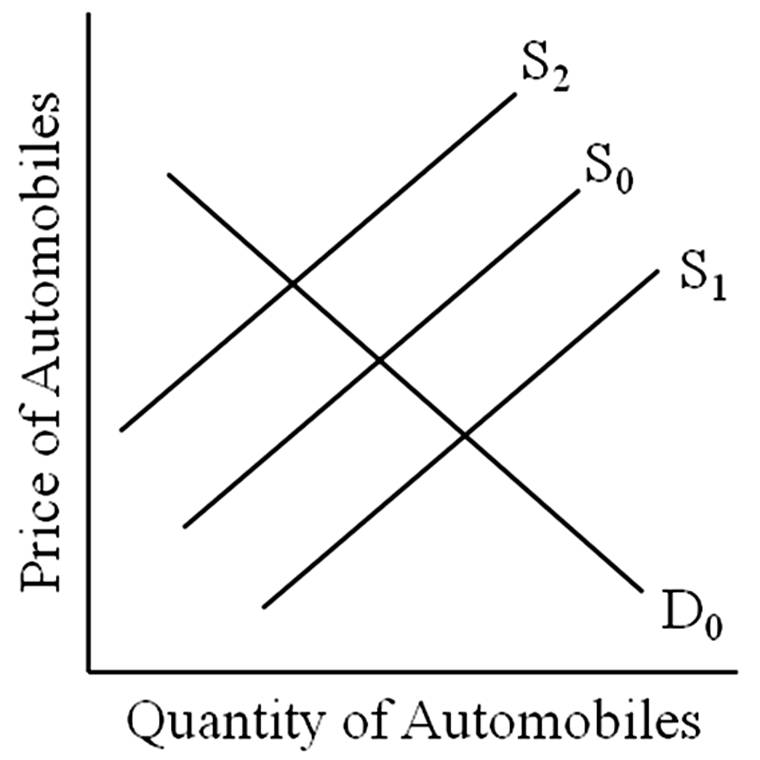
Assume the economy begins at the intersection of D0 S0. Suppose the government then instituted strong emission standards. How would this affect the supply curve?
A. Move along S0
B. Shift to S1
C. Shift to S2
D. No change