Use the following diagrams for the U.S. economy to answer the next question.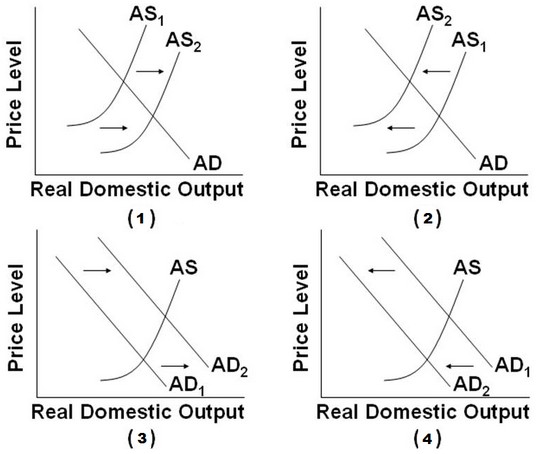 If the economy is initially at full employment, which of the diagrams best portrays a recession resulting from a decrease in government purchases?
A. Graph (1)
B. Graph (2)
C. Graph (3)
D. Graph (4)
Answer: D
You might also like to view...
A country has a comparative advantage in the production of a good if it can
A) trade off producing the good for another good. B) produce more of the good than another country. C) produce the good on and remain on its production possibilities frontier. D) produce more of the good most efficiently. E) produce the good at the lowest opportunity cost.
A sales tax imposed on sellers shifts the supply curve leftward for the taxed good because the
A) tax is paid by the seller to the government and is, therefore, like a cost of production. B) tax is actually shifted entirely onto the buyer who can afford only a smaller supply. C) higher price causes entry into the market. D) tax shifts the demand curve leftward.
What does the investment demand curve show?
What will be an ideal response?
The problem of moral hazard has led
A) the governments of many developing countries to guarantee repayment of all loans. B) to higher growth rates in Latin America. C) to excessively speculative investment. D) to both privilege and responsibility of creditors. E) to stable investments with small and steady expected gains.