Select the graph below that best shows the change in the market specified in the following situation: In the market for wheat, when the cost of fertilizer decreases
Assume that the graphs show a competitive market for the product stated in the question.
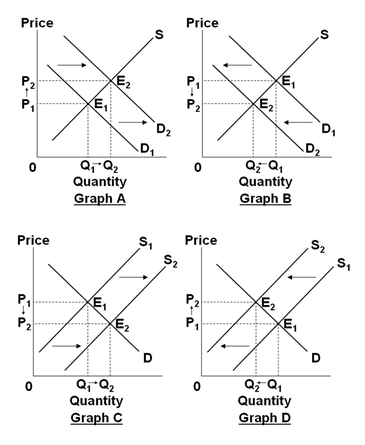
A. Graph A
B. Graph B
C. Graph C
D. Graph D
C. Graph C
You might also like to view...
The self-correcting tendency of the economy means that falling inflation eventually eliminates:
A. exogenous spending. B. recessionary gaps. C. expansionary gaps. D. unemployment.
When the labor market is in equilibrium,
A) there is full employment, which means that real GDP equals potential GDP. B) there is full employment but real GDP might be greater than, less than, or equal to potential GDP. C) the real wage rate rises to allow real GDP to equal potential GDP. D) there is excess labor supplied, which keeps real GDP less than potential GDP. E) the real wage rate falls to equal the nominal wage rate because real GDP is greater than potential GDP.
An optimum currency area is a geographic region
A) with inflation near zero. B) that allows exchange rates to float. C) that has fixed exchange rates. D) for which the benefits of having a common currency exceed the costs.
Assume a consumption function of the following form: C = 100 + .8Y. If income is equal to $3,000, then consumption is
A) $2,400. B) $2,500. C) $2,900. D) $3,100.