Below, the graph on the left shows the short-run cost curves for a firm in a perfectly competitive market, and the graph on the right shows the current market conditions in this industry. In order to maximize profit, how much output should the firm produce?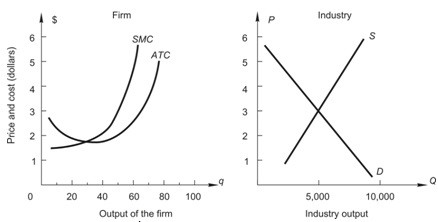
A. 60 units
B. 80 units
C. 20 units
D. 40 units
E. 50 units
Answer: E
You might also like to view...
The table above shows the exchange rates between various currencies and the U.S. dollar. Between 2015 and 2016, the Japanese yen ________ against the U.S dollar and the Euro ________ against the U.S. dollar
A) appreciated; appreciated B) depreciated; appreciated C) depreciated; depreciated D) appreciated; depreciated
Which of these indicators is probably the most politically sensitive?
A) Housing starts B) Capacity utilization C) Employment D) Car sales
Public policy
a. can reduce both frictional unemployment and the natural rate of unemployment. b. can reduce frictional unemployment, but it cannot reduce the natural rate of unemployment. c. cannot reduce frictional unemployment, but it can reduce the natural rate of unemployment. d. cannot reduce either frictional unemployment or the natural rate of unemployment.
Refer to the diagram, assuming that the firm represented is operating on curve TC 1 . If the current price of the resource rises by $20, the optimal quantity extracted in the first year will:
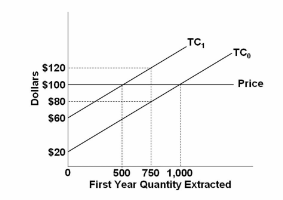
A. increase by 250.
B. increase by 500.
C. decline by 250.
D. remain unchanged.