Refer to the information provided in Figure 2.4 below to answer the question(s) that follow.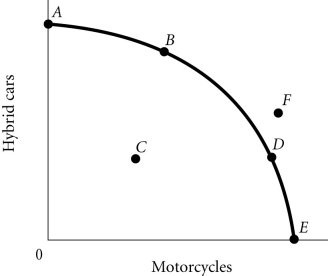 Figure 2.4According to Figure 2.4, an increase in unemployment may be represented by the movement from
A. B to A.
B. A to C.
C. C to D.
D. B to D.
Answer: B
You might also like to view...
The unemployment rate is found by dividing the number of unemployed people by the
A) number of working individuals, and multiplying by 100. B) number of the working-age population, and multiplying by 100. C) sum of working individuals plus unemployed workers, and multiplying by 100. D) number in the labor force, and dividing by 100.
The above table gives the market demand and market supply schedules for soda. What is the minimum price that producers are willing to accept for the 400th can of soda?
A) $0.40 per can B) $0.50 per can C) $0.60 per can D) $0.70 per can
The production possibilities curve for the nation of Economagic shifts to the left. This could have been caused by:
a. an increase in Economagic's labor supply. b. innovation in the production of goods in Economagic. c. a war that destroyed some of Economagic's resource base. d. unemployment among Economagic's workers. e. Economagic's choice of more consumption and less capital last period.
All of the following fiscal policies will contribute to increasing budget deficits except:
a. tax cuts. b. increases in defense expenditures. c. increases in Social Security payments to the elderly and disabled. d. cuts in aid to farmers.