The figure above shows a monopoly's total revenue and total cost curves. The monopoly's economic profit is maximized when it produces
A) 0 units of output.
B) 5 units of output.
C) 15 units of output.
D) 20 units of output.
C
You might also like to view...
Managed float exchange systems were abandoned with the implementation of the gold standard
Indicate whether the statement is true or false
The Phillips curve illustrates the relationship between
a. change in the money supply and change in unemployment. b. tax rates and tax revenues. c. the equilibrium level of income and the employment rate. d. inflation and unemployment.
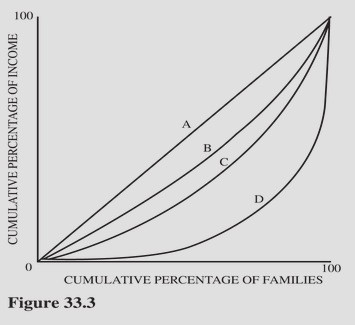 Figure 33.3 illustrates Lorenz curves for four different economies. For which economy would the lowest 20 percent of families receive the smallest share of total income?
A. A. B. B. C. C. D. D.
Assume the price of product Y (the quantity of which is on the vertical axis) is $15 and the price of product X (the quantity of which is on the horizontal axis) is $3. Also assume that money income is $60. The absolute value of the slope of the resulting budget line is
What will be an ideal response?