Make a line graph of the data in the table.The following table gives the total amount of precipitation during the given months. Use time on the horizontal scale for your line graph.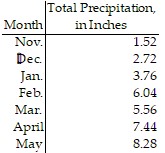
What will be an ideal response?
Answers may vary. A possible answer follows.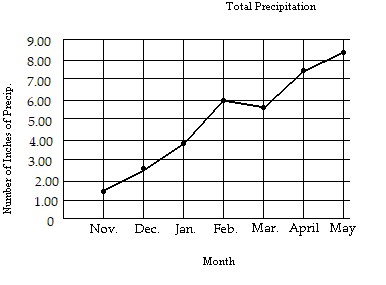
Mathematics
You might also like to view...
Find the limit of the sequence or determine that the limit does not exist.an = ln  n
n
A. 0 B. does not exist C. 4 D. ln 4
Mathematics
The scores on a 30-point multiple-choice exam are given in the following frequency table:
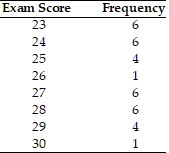 The third quartile on the exam is
A. 27.5. B. 28. C. 26.5. D. 27. E. none of these
Mathematics
Follow the proper order of operations to evaluate the following.
A. 
B. 
C. 
D. 
Mathematics
Use the prime factorization method to find the LCM of the given numbers.56 and 96
A. 224 B. 168 C. 1344 D. 672
Mathematics