The figure given below represents the effects in the labor markets due to migration. Here the world has been divided into a high-income "North" (left panel) and a low-income "South" (right panel). Dn and Sn are the labor demand and the labor supply curves in North. Ds and (Sr + Smig) are the labor demand and pre-migration labor supply curves in South. Sr is the post-migration labor supply curve in South. The value c is the cost of migrating.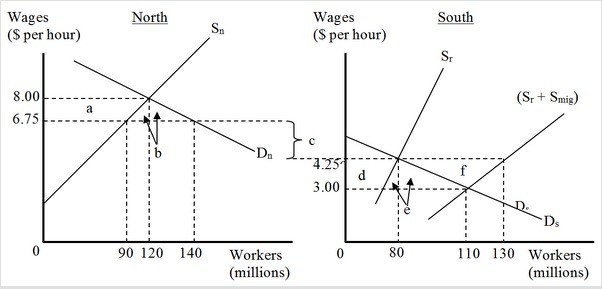 After migration of the workers, the workers in North earn ________ per hour and South workers earn ________ per hour.
A. $6.75; $3.00
B. $8.00; $3.00
C. $8.00; $4.25
D. $6.75; $4.25
Answer: D
You might also like to view...
According the Stolper-Samuelson theorem, the scarce factor in any given country should oppose international trade by that country
Indicate whether the statement is true or false
A firm uses two inputs, labor (L) and capital (K) in the production of umbrellas. It can invest $50,000 in the purchase of the two inputs annually. The firm hires 5 units of capital at $1,000 per unit. If the going annual wage rate is $4,500, calculate the number of workers employed by the firm. (Assume that the firm spends the entire budget on K and L.)
a. 10 b. 5 c. 15 d. 9
One of the roles of the Fed is to be the lender of last resort.
Answer the following statement true (T) or false (F)
The tendency for inflation to change relatively slowly from year to year in industrial countries is called:
A. potential inflation. B. inflation inertia. C. inflation expectations. D. the inflation gap.