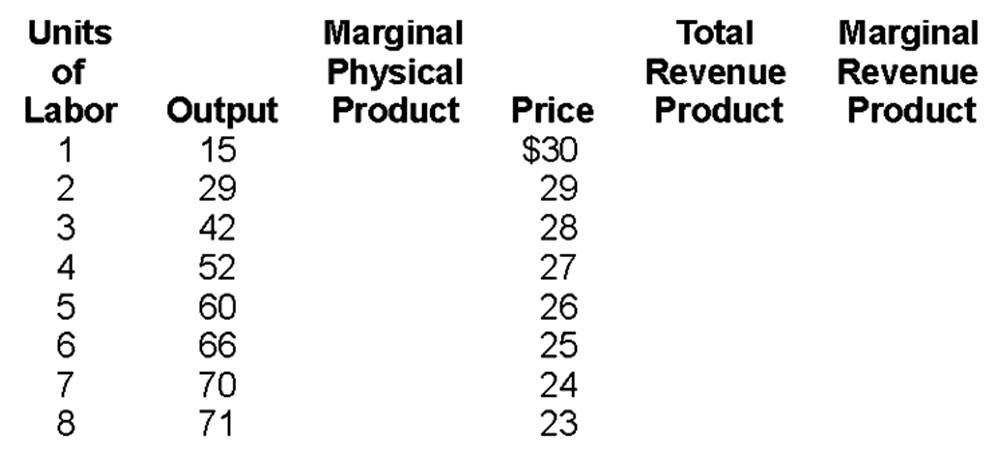
According to the graph shown, the profit being earned by this monopolist is:
This graph shows the cost and revenue curves faced by a monopoly.
A. (P3 P0) ×Q1
B. (P3 P1) × Q1
C. (P1 P0) × Q1
D. (P3 P0)/Q1
A. (P3 P0) ×Q1
You might also like to view...
Ways to "game" the budgeting process include
a. delaying sales if just short of a target b. delaying expenses if just short of a target c. accelerating sales once a target is met d. delaying expenses costs once a target is met
A duopoly is
A. a cartel in which all members try to cheat on the cartel. B. an industry with only two sellers. C. an industry with only two buyers. D. a cartel with only two members.
A product's ______ describes the amount of the product that is supplied for each possible combination of its price and other factors.
A. production function B. supply curve C. supply function D. production possibilities curve
Is the firm a perfect competitor or an imperfect competitor?