The bar graph shows the number of new residents in several towns during the years 1999 to 2001. Use the graph to answer the question.  What was the total number of new residents in Hatsburg during the years 1999 to 2001?
A. 433
B. 330
C. 321
D. 417
Answer: B
You might also like to view...
Provide an appropriate response.Give a geometric interpretation of the triple integral 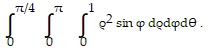 Describe the three-dimensional region associated with this integral in detail.
What will be an ideal response?
Use the simple interest formula to determine the missing value. Round dollar amounts to the nearest cent and percents to the nearest hundredth when necessaryp = $12,403, r = 3.5%, t = ?, i = $2170.53
A. t = 7 years B. t = 6 years C. t = 5 years D. t = 4 years
Solve the problem.The total sales in dollars of some small businesses fluctuates according to the equation 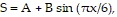 where x is the time in months, with
  corresponding to January,
  and
and  Determine the month with the greatest total sales and give the sales in that month.
A. December; $10,100 B. March; $10,100 C. June; $7100 D. September; $4100
Solve the problem.Suppose S varies directly as the cubed root of T, and that S = 24 when T = 1. Find T when S = 96.
A. 64 B. 1 C. 24 D. 4