The diagram above illustrates the pattern of:
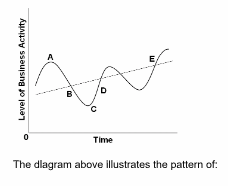
A. Business cycles
B. Wage movements over time
C. Price level movements
D. Economic growth patterns
A. Business cycles
You might also like to view...
Social Security provides incentive for individuals to
(a) save more than they consume during their working years. (b) manage their assets privately in order to prepare to live on principal and interest during retirement. (c) rely on transfer payments made by the working class to them during retirement. (d) carefully manage their private retirement portfolios and use the income earned to consume and save during retirement.
A increase in quantity demanded as a result of a change in price
A) is a rightward shift of the demand curve. B) is a leftward shift of the demand curve. C) leaves the demand curve unchanged. D) is not possible.
Suppose that Amber's demand for gasoline is given by G = 1000 - 200PG, where G stands for gallons of gas and PG represents the price of gas. (a) Suppose gas sells for $2 per gallon. What is Amber's consumer surplus? Illustrate your answer graphically. (b) Suppose the price of gas rises to $3 per gallon. What is the change in Amber's consumer surplus? Illustrate this change in your graph
What will be an ideal response?
The U.S. president convinces Congress to fund a national program to land astronauts on Mars. This action, all other things held constant, increases government spending and ______.
a. decreases net exports b. shifts the aggregate demand curve to the right c. causes movement along the aggregate demand curve d. increases consumer saving