The circle graph shows the results of the student council presidential election. The complete circular area represents 100% of the votes.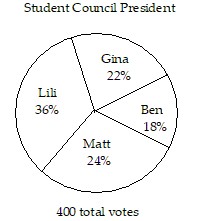 The circle graph shows what percent of the vote each person received.Who got the fewest votes?
A. Lili
B. Matt
C. Ben
D. Gina
Answer: C
Mathematics
You might also like to view...
Find the special products using patterns.(3p + 2)(3p - 2)
A. 9p2 - 12p - 4 B. 9p2 - 4 C. p2 - 4 D. 9p2 + 12p - 4
Mathematics
Solve the linear equation symbolically.53 = -6x - 7
A. 70 B. 66 C. -10 D. 1
Mathematics
Find the grade point average. Round to the nearest tenth when necessary.The grades are given for a student for a particular semester. Find the grade point average. Assume the grade point values are A = 4, B = 3, C = 2, D = 1, and F = 0. C3 B1 C2 A2 B3
A. 11 B. 2.7 C. 2.8 D. 2.2
Mathematics
List the elements of the set.If A = {9, 10, 11, 14} and B = {7, 9, 10, 12}, list the elements of 
A. ? B. {7, 9, 10, 11, 12, 14} C. {7, 11, 12, 14} D. {9, 10}
Mathematics