Refer to the information provided in Figure 2.5 below to answer the question(s) that follow.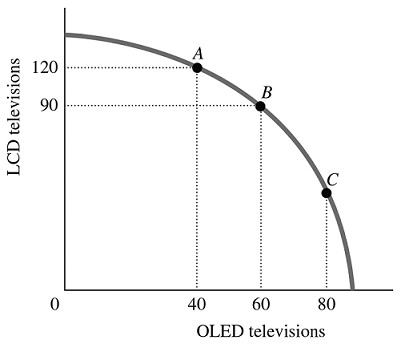 Figure 2.5Refer to Figure 2.5. For this economy to move from Point C to Point B, ________ additional LCD TVs could be produced when the production of OLED TVs is reduced by 20.
A. exactly 30
B. exactly 60
C. fewer than 30
D. more than 30
Answer: C
You might also like to view...
Refer to the figure below. If Laura and Chris are the only two consumers in this market then at a price of $2.50 per pound, the market demand for hamburger is: 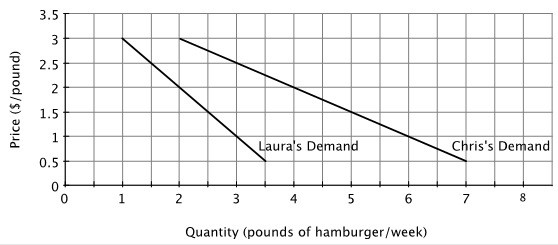
A. 4.5 pounds per week B. 1.5 pounds per week C. 3 pounds per week D. 4 pounds per week
The vertical axis of a graph that shows a market supply curve indicates the
A. various quantities of output at which the market will be cleared. B. cost of the amount of output produced. C. number of sellers who are in the market for this product. D. prices at which firms would be willing and able to sell their different products.
You have the choice of going to Hawaii for a week, staying at work for the week, or spending the week skiing. If you decide to go to Hawaii, the opportunity cost is
A) the value of working and skiing. B) the value of working or skiing, depending on which you would have done rather than go to Hawaii. C) working, because you would be giving up a week's pay. D) none of the above if you enjoy the time spent in Hawaii.
Price elasticity of demand along a linear, downward-sloping demand curve decreases as price falls
a. True b. False Indicate whether the statement is true or false