The following data show the number C, in thousands, of concerts presented by symphony orchestras t years after 1990.
t 0 5 10 12 17 C 18.93 29.33 33.15 37.12 37.17?
A: Use logistic regression to model C as a function of t.B: Plot the graph of the data along with the model you found in part A.C: According to the model, what is the maximum number of concerts that will ever be performed in a year?D: When did the number of concerts reach 32.00 thousand?
?
Round your answers to two decimal places, if necessary.
What will be an ideal response?
?
B:
?
?
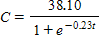
C: 38.10 thousand
?
D: 7.21 years after 1990
You might also like to view...
Provide an appropriate response.True or False?The sum of two irrational numbers is always irrational.
A. True B. False
Express the limit as a definite integral.
 ?xk, where P is a partition of [0, 4?]
A.  dx
dx
B.  dx
dx
C.  dx
dx
D.  dx
dx
A committee consists of six members (A, B, C, D, E, and F). A has veto power; B, C, D, and E each have one vote. F is a nonvoting member. For a motion to pass it must have the support of A plus at least two additional voting members.Which are the critical players in the coalition {A, B, D}?
A. A only B. B only C. A, B, and D D. D only E. none of these
Find a formula for the nth term of the arithmetic sequence shown in the graph.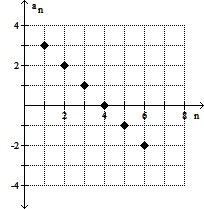
A. an = 4 - n B. an = n + 2 C. an = n + 3 D. an = n - 4