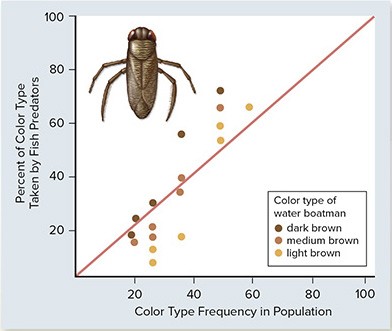
 The percentage of different colored water boatmen (an aquatic insect) eaten by fish were graphed relative to the frequency of that color in different populations. Based on the graph, what conclusion can you draw?
A. Rare phenotypes will survive better due to positive-frequency selection.
B. Common phenotypes will survive better due to negative-frequency selection.
C. Common phenotypes will survive better due to positive-frequency selection.
D. Rare phenotypes will survive better due to negative-frequency selection.
Answer: D
You might also like to view...
What do you think the pattern of inheritance of the human SRY gene is called?
What will be an ideal response?
How old was the world thought to be when Darwin began his voyage? How old is it thought to be
now? What will be an ideal response?
The most common survival trisomy is trisomy 13. Indicate whether the statement is true or false
Imagine an invertebrate that lives in an estuary where salinity varies cyclically with the tides. If this animal practices homeostasis with respect to the salt concentration of its body fluids, its salt concentration will show ________
A) no fluctuations B) slight, continuous fluctuations C) a more concentrated state than the surrounding water at all times D a more diluted state than the surrounding water at all times