Solve the problem.The bar graph below shows a company's yearly profits from 1991 to 1999. Let an represent the company's profit, in millions, in year n, where n=1 corresponds to 1991, n = 2 corresponds to 1992, and so on. 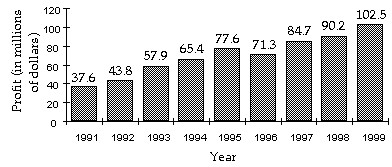 Find
Find 
A. $631 million
B. $650.8 million
C. $140.1 million
D. $593.4 million
Answer: A
Mathematics
You might also like to view...
Find numbers a and b, or k, so that f is continuous at every point.


A. k = - 
B. k = 
C. k = 7
D. k = 
Mathematics
Classify the polygon by name. If it is a quadrilateral, give its specific name.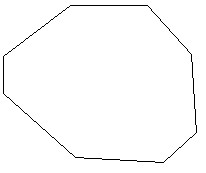
A. Decagon B. Hexagon C. Octagon D. Heptagon
Mathematics
Determine the coordinates of the focus and the equation of the directrix of the parabola.y2 = 40x
A. F(10, 0), x = 10 B. F(0, 10), y = -10 C. F(10, 0), x = -10 D. F(10, 10), x = 10
Mathematics
Match the surface show below to the graph of its level curves.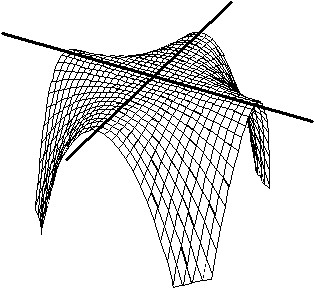
A. 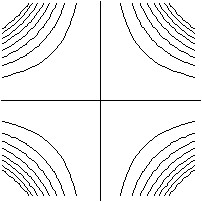
B. 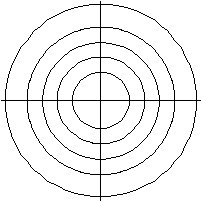
C. 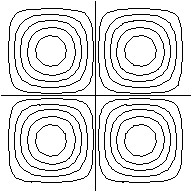
D. 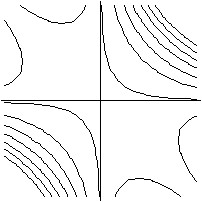
Mathematics