Solve the problem.The following scatter diagram shows heights (in inches) of children and their ages.Height (inches)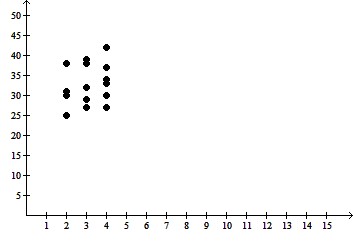 Age (years)What is the expected height range for a 2-year old child?
A. 25-38 inches
B. 20-30 inches
C. 35-45 inches
D. 40-50 inches
Answer: A
You might also like to view...
Solve the problem.The period of vibration P for a pendulum varies directly as the square root of the length L. If the period of vibration is 4 sec when the length is 64 inches, what is the period when 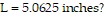 (Round to the nearest hundredth.)
A. 5.00 sec B. 4.75 sec C. 1.13 sec D. 4.50 sec
Given p is true, q is true, and r is false, find the truth value of the statement.~q ? (p ? ~r)
A. False B. True
Solve the right triangle shown in the figure. Round lengths to one decimal place and express angles to the nearest tenth of a degree. 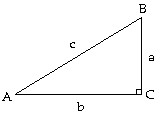 B = 34°, b = 45.9
A. A = 56°, a = 68, c = 55.4 B. A = 56°, a = 68, c = 82.1 C. A = 34°, a = 31, c = 38.1 D. A = 34°, a = 31, c = 82.1
Use the graph to answer the question.  Which month in 2006 had the lowest sales?
A. Month 8 B. Month 2 C. Month 3 D. Month 6