Refer to the information provided in Table 6.3 below to answer the question(s) that follow.
Table 6.3Dozens of Oysters per DayTotal UtilityMarginal Utility160?2104?3134?4152?5?8Number ofBeers per DayTotal UtilityMarginal Utility140?270?394?4114?5?14Refer to Table 6.3. Diminishing marginal utility sets in after the ________ dozen oysters per day.
A. first
B. second
C. third
D. fourth
Answer: A
You might also like to view...
Production data for Joe's Pizza Parlor are as follows. For simplicity assume that labor is the only input. Each pizza sells for $5. Number of WorkersPizzas Baked Per Day00110218324430532How many workers will Joe hire if he must pay each one $25 a day?
A. 1 B. 2 C. 3 D. 4
Graphically illustrate the recycled newsprint market based on the supply and demand equations given. Provide numerical labels, including the values derived in Question 1.
THE MARKET FOR RECYCLED NEWSPRINT
The amount of trash generated in the United States has risen from 88.1 million tons in 1960 to 243.0 million tons in 2009. Of this tonnage, approximately 28.2 percent is paper and paperboard. In a logical move, many communities established paper recycling programs in the 1980s. The first step was to encourage individuals and firms to bring paper wastes to collection centers. According to EPA data, as shown in the accompanying table, this recovery stage has met with some success.
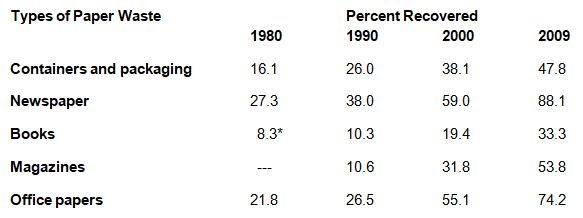
*The 8.3 in 1980 represents books and magazines, which were reported in the aggregate prior to 1990.
Although these data suggest that society responded responsibly, they belie a very real problem. Many communities failed to recognize the need to create a market for recovered materials. This was precisely the problem that arose during the late 1980s and continued into the 1990s. The result was insufficient demand for recovered newspapers, and the excess supply sent the price of used newsprint plummeting.
To correct the problem, it was necessary to stimulate market demand. Virtually all levels of government took an active role. A number of state governments passed laws requiring newspapers to be partly printed on recycled paper. At the federal level, President Clinton signed Executive Order 12873, calling for all printing and writing paper to contain at least 20 percent recovered paper. (This amount was subsequently raised to 30 percent in Executive Order 13101.) The EPA established clearinghouses and hotlines to bring together suppliers and demanders of recyclables. Added influences were the thriving domestic economy and the rising demand of developing nations, whose growth required new sources of paper inputs.
Taken together, market demand eventually swamped existing supplies, and in 1995, there was a shortage of recycled newsprint. Just as predicted by economic theory, the shortage placed upward pressure on price, which rose to between $100 and $200 per ton. The boom in the market was temporary, however. By 1996, excess supplies and falling demand drove prices back to the $20 per ton level of the early 1990s.
Such volatility is characteristic of this market and continues through the present day. As a case in point, assume that the market demand for recycled newsprint in 2011 is QD = 200 – 2P and that market supply is QS = –150 + 5P, where P is the price per ton and Q is the quantity in thousands of tons per year.
Use the table below to answer the following question.PriceQuantity Supplied$101089684726Over the $8 to $6 price range, supply is
A. zero. B. unit-elastic. C. elastic. D. inelastic.
The issue with centralized versus decentralized decision making is that
A. it is always easy to find out which is better, but not all may agree. B. centralization is always better because one person controls all information. C. decentralization is always better because many people can split the tasks. D. it is difficult to find out whether one is better than the other in the hierarchy.