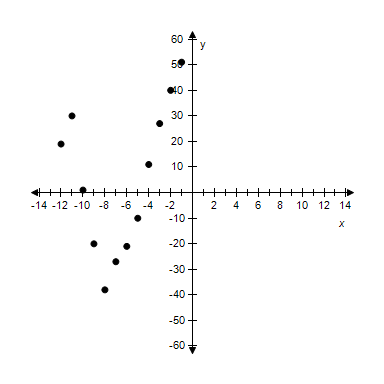
Sketch a scatter plot of the data shown in the table.The table shows the lowest temperature on record y (in degrees Fahrenheit) in Duluth, Minnesota for each month x where x = 1 represents from January.
Months, x
Temperature, y
1
-46
2
-36
3
-23
4
-7
5
14
6
25
7
31
8
42
9
24
10
3
11
-26
12
-15
A. 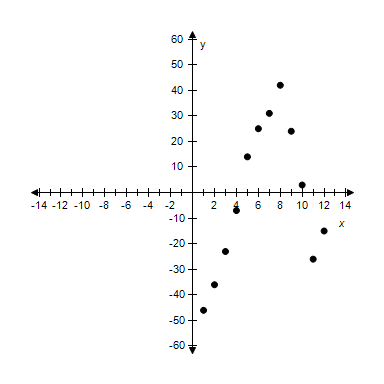
x: Months (1 ? January)
y: Temperature (in Fº)
B.
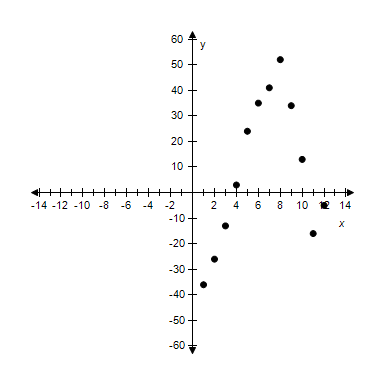
x: Months (1 ? January)
y: Temperature (in Fº)
C.
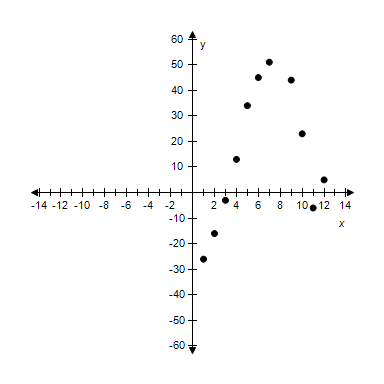
?
x: Months (1 ? January)
y: Temperature (in Fº)
D.
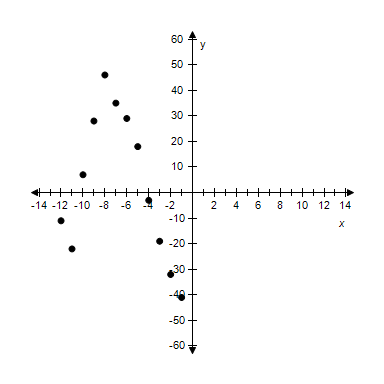
?
x: Months (1 ? January)
y: Temperature (in Fº)
E.
x: Months (1 ? January)
y: Temperature (in Fº)
Answer: A
You might also like to view...
Graph the function, then find the extreme values of the function on the interval and indicate where they occur.y =  +
+  on the interval -5 < x < 5
A. 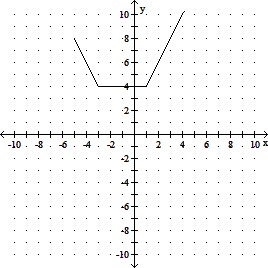
Absolute minimum is: 4 on the interval [-3, 1]
B. 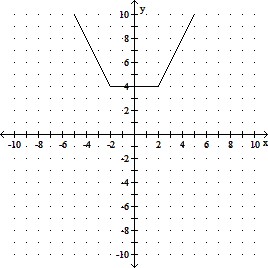
Absolute minimum is: 4 on the interval [-1, 3]
C. 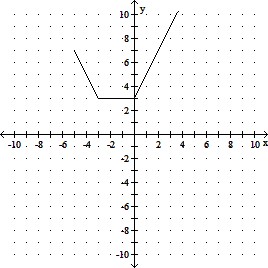
Absolute minimum is: 5 on the interval [-3, 1]
D. 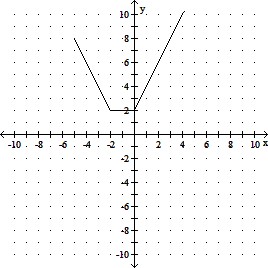
Absolute minimum is: 5 on the interval [-1, 3]
Evaluate. Round dollar amounts to the nearest cent and other answers to the nearest thousandth when necessary.P kn for P = $1,000, n = 6, r = 7% k = 1
A. $1605.78 B. $1402.55 C. $1500.73 D. $500.73
Write the expression in the standard form a + bi.6i(6 - 9i)
A. 36i - 54i2 B. 54+ 36i C. 36i + 54i2 D. 36i- 54
Find an equation for the parabola described.Vertex at (2, 3); focus at (5, 3)
A. (x - 3)2 = -8(y - 3) B. (y - 3)2 = -12(x - 2) C. (y - 3)2 = 12(x - 2) D. (x - 3)2 = 8(y - 3)