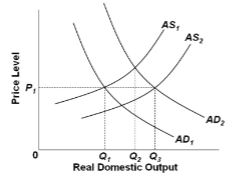
In the figure, AD 1 and AS 1 represent the original aggregate supply and demand curves and AD 2 and AS 2 show the new aggregate demand and supply curves. The changes in aggregate demand and supply in the diagram produce:
A. a higher price level.
B. an expansion of real output and a stable price level.
C. an expansion of real output and a higher price level.
D. a decline in real output and a stable price level.
B. an expansion of real output and a stable price level.
You might also like to view...
Assume the marginal propensity to consume is 0.8. If consumer spending increases by $20 billion, then real GDP will
A. decrease by $100 billion. B. increase by $16 billion. C. increase by $100 billion. D. not change.
Which of the following is likely to happen if the annualized growth rate of money supply increases while real GDP remains unchanged?
A) The unemployment rate will rise. B) The nominal GDP will fall. C) The inflation rate will fall. D) The inflation rate will rise.
Traditional Keynesian economists believed that:
a. the aggregate supply curve is a vertical line at a fixed level of prices. b. an increase in aggregate demand would cause a change in the price level. c. the government should take an active role in the economy to restore equilibrium. d. changes in aggregate demand does not determine equilibrium real GDP. e. the private sector is not an important source for shifts in aggregate demand.
A change in a price of a substitute input for labor will cause
A. a change in the demand for labor in the same direction of the price change. B. a change in the supply of labor in the opposite direction of the price change. C. no change in the demand for labor. D. a change in the demand for labor in the opposite direction of the price change.