The line graph shows the recorded hourly temperatures in degrees Fahrenheit at an airport. 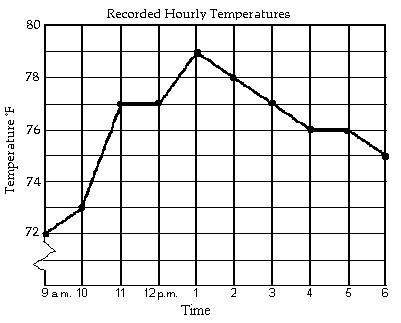 During which hour did the temperature increase the most?
A. 9 a.m. to 10 a.m.
B. 12 p.m. to 1 p.m.
C. 10 a.m. to 11 a.m.
D. 1 p.m. to 2 p.m.
Answer: C
Mathematics
You might also like to view...
Convert the polar equation to a rectangular equation.r2 sin 2? = 4
A. xy = 4 B. x2 + y2 = 4 C. y2 = 4 D. xy = 2
Mathematics
Find the vertex of the parabola.h(x) =  x2 - 6x -
A. 
B. 
C. 
D. 
Mathematics
Find the equilibrium vector for the transition matrix. Round the numbers in your answer to the nearest hundredth.
A. 
B. 
C. 
D. 
Mathematics
The bar graph shows the number of tickets sold each week by the garden club for their annual flower show.?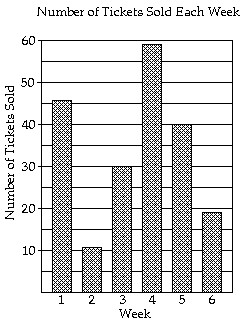 During which week was the most number of tickets sold?
A. week 5 B. week 2 C. week 4 D. week 1
Mathematics