Solve the problem.The following data represents the height (in inches) and weight (in pounds) of 9 randomly selected adults. 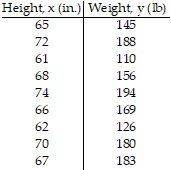 Graph the data on a scatter diagram treating height as the independent variable. Find an equation of the line containing the points (62, 126) and (70, 180). Express the relationship using function notation. Graph the line on the scatter diagram. Interpret the slope of the line. Use the line to predict the weight of a person who is 64.6 inches tall. Round to the nearest pound.
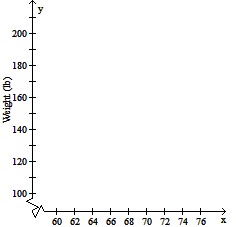 Height (inches)
What will be an ideal response?
| Height (inches) |
W(h) = 6.75h - 292.5;
If height is increased by one inch, then weight will increase by 6.75 pounds;
144 lb
Mathematics
You might also like to view...
Add or subtract, if possible. Assume that all variables represent non-negative values. Simplify your answer. 5 -2
-2 - 9
- 9 - 3
- 3
A. -4 - 5
- 5
B. -4 -
- 
C. 14 - 5
- 5
D. 14 +
+ 
Mathematics
Solve the problem. Round your answer to the nearest tenth unless indicated otherwise.Carol and Lu Yi carry a total of 5.5 liters of water as they begin a day hike. How many gallons of water are they carrying, to the nearest tenth?
A. 5.2 gal B. 20.8 gal C. 1.4 gal D. 5.8 gal
Mathematics
Use the graph to find the vertical asymptotes, if any, of the function. 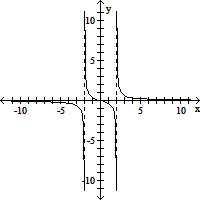
A. x = -2, x = 2, y = 0 B. x = -2, x = 2 C. none D. x = -2, x = 2, x = 0
Mathematics
Determine whether the sequence is arithmetic.2, 4, 6, 10, 12, ...
A. Arithmetic B. Not arithmetic
Mathematics