Figure 7-6
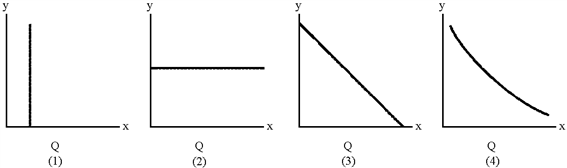
Which of the lines in Figure 7-6 represents a typical average fixed cost curve?
a.
1
b.
2
c.
3
d.
4
d
You might also like to view...
Which of the following shows the combination of two products that have the same utility or satisfaction?
A. Production possibility curve B. Insignificance curve C. Demand curve D. Indifference curve
When a firm produces output,
A) The value of the output produced is included in GDP B) The firm's output contributes to GDP only to the extent that there is value-added. C) The firm's output will not count as GDP if it is stored as inventory. D) The firm's output will not count as GDP if it is exported.
What measures would likely lower infant mortality rates in the United States?
a. Prenatal care programs in low-income neighborhoods. b. Reduced drug use among expectant mothers. c. Better nutrition. d. Delaying childbearing beyond the teen-age years. e. All of the above.
Which of the following best expresses the law of diminishing returns?
A. Because large-scale production allows the realization of economies of scale, the real costs of production vary directly with the level of output. B. Population growth automatically adjusts to that level at which the average product per worker will be at a maximum. C. As successive amounts of one resource (labor) are added to fixed amounts of other resources (capital), beyond some point the resulting extra or marginal output will decline. D. Proportionate increases in the inputs of all resources will result in a less-than-proportionate increase in total output.