Use the data in the table to construct a bar graph.The following table shows the revenue for a company (in millions of dollars) for the four quarters of 1999 and 2000.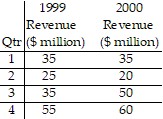
What will be an ideal response?
Answers may vary. One possible answer:
Mathematics
You might also like to view...
Given that p and q each represents a simple statement, write the indicated symbolic statement in words.p: Darren dislikes Zoeq: Zoe dislikes Darren~ q ? p
A. Zoe and Darren do not dislike each other. B. It is not true that Zoe dislikes Darren or that Darren dislikes Zoe. C. Zoe does not dislike Darren, but Darren dislikes Zoe. D. Zoe does not dislike Darren, or Darren dislikes Zoe.
Mathematics
Name the property used to go from step to step indicated by an a), b), c), or d).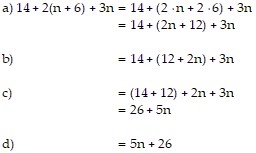
What will be an ideal response?
Mathematics
Provide an appropriate response.Reduce the matrix: 
What will be an ideal response?
Mathematics
Graph the two functions on one coordinate plane.f(x) =  g(x) =
  + 1
+ 1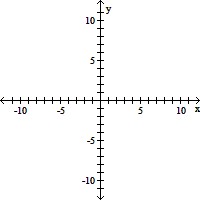
A. 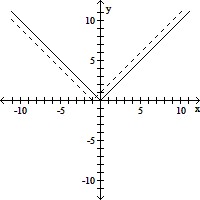
B. 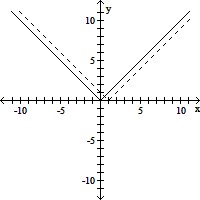
C. 
D. 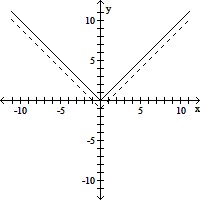
Mathematics