Use the following graph which shows the monthly sales of a heating supplier. 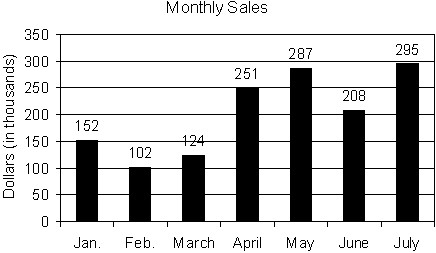 What was the percent of decrease in sales from April to June?
A. 20.7%
B. 17.1%
C. 43%
D. 14.3%
Answer: B
Mathematics
You might also like to view...
Choose the graph that matches the given function.f(x) =  - 1
- 1
A. 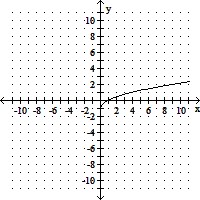
B. 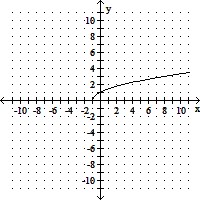
C. 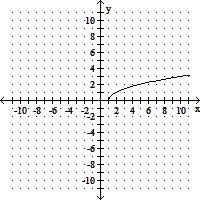
D. 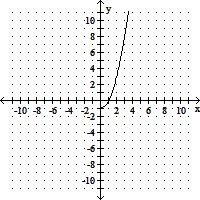
Mathematics
Find the foci of the given hyperbola. -
-  = 1
= 1
A. (-7, -3), (1, -3) B. (-3, -7), (-3, 1) C. (-8, -3), (2, -3) D. (-3, -8), (-3, 2)
Mathematics
Solve the inequality. Express your answer using interval notation. ? 5 +
? 5 + 
![]()
A. (18, ?)![]()
B. [18, ?)![]()
C. (-?, 18]![]()
D. [-18, ?)![]()
Mathematics
Graph the polynomial function. f(x) = -x2(x - 1)(x + 1)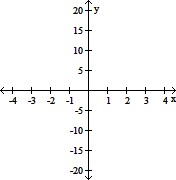
A. 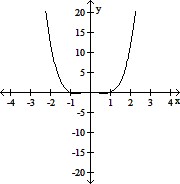
B. 
C. 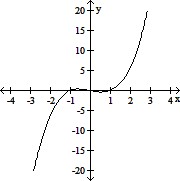
D. 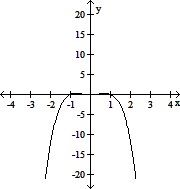
Mathematics