This graph represents the cost and revenue curves of a firm in a perfectly competitive market.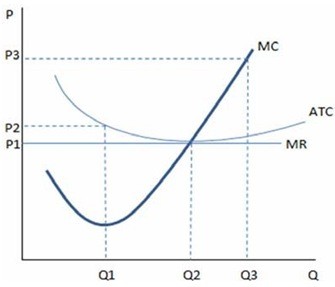 According to the graph shown, the long-run output decision for this firm is:
A. Q2, P1.
B. Q1, P2.
C. Q1, P1.
D. Q3, P3.
Answer: A
You might also like to view...
Suppose a cancer patient decides to forsake weekly chemotherapy treatments in order to spend more meaningful, loving time with her friends and family. In cases where patients refuse treatment,
A) there are indeed substitute for chemotherapy, such as time with family. B) the patient is behaving irrationally. C) the patient doesn't know what is in her long-run best interest. D) the patient fails to see that chemotherapy is a better substitute than time with the family.
The leakage and injections approach implies that deficit spending by the government must be financed by
A) private investment less private savings plus net exports. B) private saving less private investment plus net exports. C) the trade deficit must always offset the government deficit. D) B and C.
When the government controls the price of a product, causing the market price to be above the free market equilibrium price,
A) all producers gain. B) both producers and consumers gain. C) only consumers gain. D) some, but not all, sellers can find buyers for their goods.
One should be especially wary of the national-security argument for restricting trade when that argument is made by
a. representatives of industry. b. representatives of the defense establishment. c. members of households. d. foreign government officials.