Consider the two graphs below. Graph A represents a typical firm in a purely competitive industry. Graph B represents the supply and demand conditions in that industry. The dashed horizontal line represents the current market price for firms and for
the industry. In the long run, what will happen to price, profit, the supply curve, and the number of firms in the industry?
What will be an ideal response?
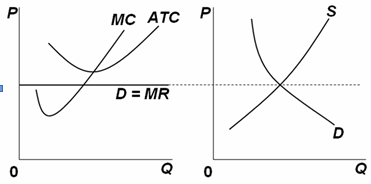
At the current market price, firms are experiencing economic losses because the market price is less than the minimum ATC. The economic losses will drive some firms out of the industry, leading to a decreased supply in the industry, so the supply curve will shift to the left. This change will increase the market price so the MR line will rise until it just equals the minimum ATC, thus eliminating the economic losses.
You might also like to view...
Does a perfectly competitive producer have any incentive to lower its price so it is below the current market price? Explain your answer
What will be an ideal response?
Between August 2007 and July 2008, Brazil exported more than 3.5 billion pounds of coffee to the rest of the world. Suppose the Brazilian government subsidizes the export of coffee by $0.42 per pound
Which of the following would be an outcome of this subsidy? A) Brazilian producers experience an increase in producer surplus. B) Brazilian consumers experience an increase in consumer surplus. C) Producers from the rest of the world experience a gain in producer surplus. D) Brazilian coffee exports would decrease.
In the figure above, Gap maximizes its profit if it charges ________ per jacket
A) $100 B) $95 C) $75 D) $120
In which of the following contracts is the agent's payment unaffected by his performance?
A) fixed-fee contract B) hire contract C) contingent contract D) sharing contract