This graph demonstrates the domestic demand and supply for a good, as well as the world price for that good.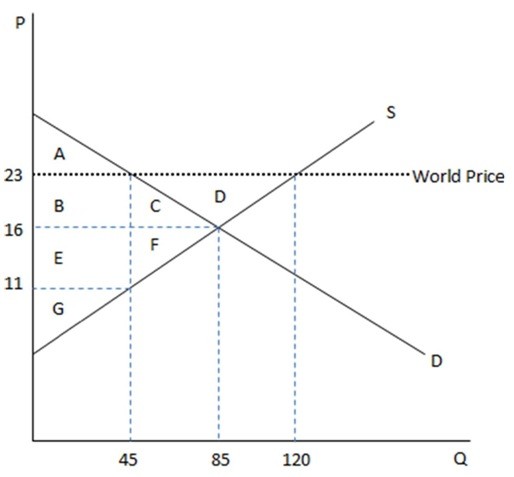 According to the graph shown, if this were depicting an autarky economy, the amount being bought domestically is:
A. 45 at $23 each.
B. 45 at $11 each.
C. 120 at $23 each.
D. 85 at $16 each.
Answer: D
You might also like to view...
A Treasury expenditure financed through borrowing from the Federal Reserve will cause the money supply
A) and bank reserves to rise by an equal amount. B) and bank reserves to fall by an equal amount. C) to rise but bank reserves to rise by a greater amount. D) to rise by a greater amount than the rise in bank reserves.
Oligopoly is a market structure where one firm produces all of the output in the market
a. True b. False Indicate whether the statement is true or false
Over 17 million American households had a net worth over $1 million. This means:
A. their total income minus expenses was greater than $1 million. B. the Lorenz curve would show $1 million for over 17 million households. C. their assets minus liabilities were greater than $1 million. D. more than $1 million flowed through the accounts of over 17 million households.
Refer to Table 24-10. How much was the cost of the basket in 2008?
a. $78.25 b. $84.75 c. $169.50 d. $456.50