The following diagram shows the rate of inflation each year during a five year span. Use this diagram to answer the next question.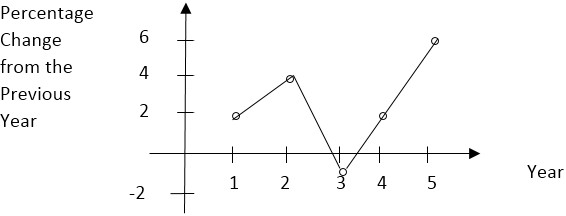 In which year did prices go down?
A. Year 1
B. Year 2
C. Year 3
D. Year 4
Answer: C
You might also like to view...
Output in the goods and services market will be sustained into the future
a. if aggregate demand and short-run aggregate supply are in balance. b. only when the prior choices of decision makers were based on a correct anticipation of prices. c. only when prices are rising. d. only when wage rates are declining.
What does it mean for the Fed to be the "lender of last resort?"
Which of the following will increase the money supply?
A) an increase in the discount rate (relative to the federal funds rate) B) a decrease in the required reserve ratio C) an open market sale by the Fed D) a and c E) b and c
Given the strict quantity theory of money, if the quantity of money doubled, prices would:
A. fall by half. B. double. C. remain constant. D. increase somewhat but less than double.