The graph of a function f is given. Use the graph to answer the question.What are the x-intercepts?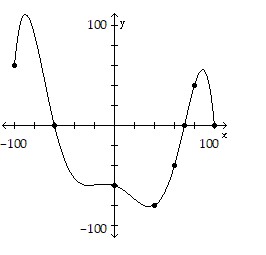
A. -60, 70, 100
B. -60
C. -100, -60, 70, 100
D. -60, 70
Answer: A
You might also like to view...
Solve the problem.The average waiting time in a line before getting served is given by ?W =  where A is the average rate that people arrive at the line and S is the average service time. At a certain bank, the average service time is 4 minutes. By sketching a graph of the equation on the interval
  answer the following questions. What happens to W when A is close to zero? Why does this make sense? What feature of your graph gives this information?
What will be an ideal response?
Divide.
A. 92 B. 0.00092 C. 9.2 D. 0.092
Write the inequality using interval notation, and illustrate the inequality using the real number line.5 ? x ? 10![]()
A. (5, 10]![]()
B. [5, 10]![]()
C. (5, 10)![]()
D. [5, 10]![]()
Add. Convert the measure to the one that is underlined.7.99 kg + 237 g
A. 8227 kg B. 8.227 kg C. 1036 kg D. 237,007.99 kg