Provide the appropriate response.In a recent city election, 73,457 people voted for Hayes, 67,895 people voted for Mills, 5,698 people voted for Braun, and 452 voted for Simpson. What would be the best way to represent this information?
What will be an ideal response?
Answers will vary. Finding percentages and using a table or circle graph would be good approaches.
Mathematics
You might also like to view...
Use the properties of logarithms to find the exact value of the expression. Do not use a calculator.log2 34 - log2 17
A. 17 B. 1 C. 2 D. 34
Mathematics
Evaluate.i33
A. -i B. -1 C. i D. 1
Mathematics
Use the graph of y = f(x) to state the value of the requested quantity if it exists. f(x)
f(x)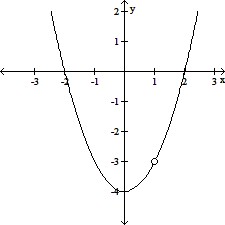
A. does not exist B. 3 C. 1 D. -3
Mathematics
Perform the indicated operation. Write the answer in simplest form. If the answer is an improper fraction, write it as a mixed number.
A. 9
B. 10
C. 10
D. 13
Mathematics