Using the table provided above, what can be concluded about the Gini ratio and what does this mean for income equality?
A) The Gini ratio is increasing which means there is greater income inequality.
B) The Gini ratio is increasing which means there is greater income equality.
C) The Gini ratio is decreasing which means there is greater income equality.
D) The Gini ratio is decreasing which means there is greater income inequality.
A
You might also like to view...
Compare and contrast a general retail sales tax with a value added tax
What will be an ideal response?
As marginal physical product diminishes, marginal revenue product
A. Rises at a diminishing rate and eventually falls. B. Also diminishes. C. Rises. D. Is not affected.
Using Figure 1 above, if the aggregate demand curve shifts from AD1 to AD2 the result in the long run would be: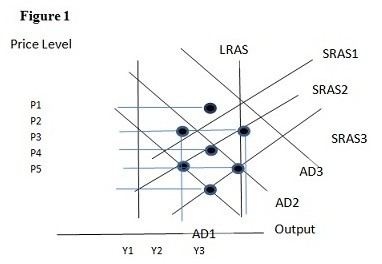
A. P1 and Y2. B. P2 and Y2. C. P3 and Y1. D. P2 and Y3.
The worst recessions after World War II occurred
A. during 1945-1946 and 1981-1982. B. during 1957-1958 and 1973-1975. C. during 1945-1946 and 1973-1975. D. during 1973-1975 and 1981-1982.