Exhibit 10-5 Aggregate demand curves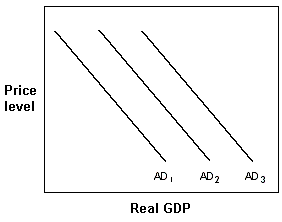
In Exhibit 10-5, which one of the following could cause the U.S. aggregate demand curve to move from AD3 to AD2?
A. greater resource availability
B. nonfluctuating resource availability
C. a recession in Japan
D. an increase in government grants for AIDS awareness programs
Answer: C
You might also like to view...
A labor force survey in Brownland records the following data:
Employed: 189,000 Unemployed: 15,000 Not in the labor force: 84,000 a) Calculate the unemployment rate. b) Calculate the labor force participation rate.
Explain why debt is usually measured using the debt-to-GDP ratio rather than the absolute amount of debt
What will be an ideal response?
Provide a justification for favoring in-kind transfer payments over cash transfer payments. Why might the fungibility of money erode the strength of this justification?
What will be an ideal response?
Economic profits and losses are true market signals because they
A) convey information in an asymmetrical fashion. B) convey information about rewards people should anticipate experiencing by shifting resources from one activity to another. C) convey information to public officials about where to encourage people to invest and what skills people should develop. D) cause people to move into careers in both undesirable and desirable industries with equal ease.