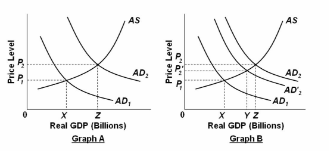
Refer to the diagrams. Suppose that government undertakes fiscal policy designed to increase aggregate demand from AD 1 to AD 2 and thereby to increase GDP from X to Z. In terms of graph B, which of the following might explain why GDP increases to Y rather than to Z?
A. Depreciation of the dollar.
B. Reduction in tariffs imposed by our trading partners.
C. Decrease in the saving schedule.
D. Crowding-out effect.
D. Crowding-out effect.
You might also like to view...
Restricting imports
A) can protect United States jobs in the protected industry, which increases economic welfare of the country as a whole. B) can protect United States final goods and services in the protected industry and makes consumers better off. C) can protect United States final goods and services in the protected industry and increase economic welfare of the country as a whole. D) can protect United States jobs in the protected industry but will also lead to reductions in U.S. output and income.
Which of the following best describes stagflation?
a. Rising unemployment together with economic growth b. Deflation coupled with a decline in money supply c. Deficits coupled with rising unemployment d. Rising unemployment and high inflation rates e. Inflation coupled with balance of trade deficits
A competitive market will typically experience entry and exit until accounting profits are zero
a. True b. False Indicate whether the statement is true or false
The money, time, and opportunity used to change prices to keep pace with inflation are called:
A. the velocity of inflation. B. menu costs. C. shoe-leather costs. D. tax distortions.