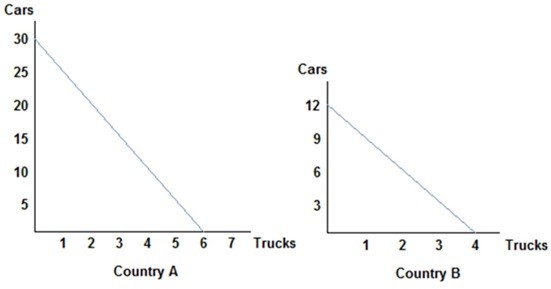
 Refer to the figure shown, which represents the production possibilities frontiers for Countries A and B. The slope of Country A's production possibilities frontier:
A. measures the trade-off that Country A face when deciding how to allocate resources.
B. measures the opportunity cost of trucks in terms of cars.
C. is constant because the opportunity cost remains constant.
D. All of these statements are true.
Answer: D
You might also like to view...
The social interest theory of regulation predicts that the political process will seek to minimize
A) producer surplus. B) consumer surplus. C) total surplus. D) deadweight loss.
The real discount rate and the nominal discount rate differ in their treatment of
A) risk. . B) market return. C) inflation. D) expected risk.
Approximately how much of aggregate national income in the United States is spent on health care today?
A) 2 percent B) 7 percent C) 17 percent D) 34 percent
If the quantity of a good supplied is highly sensitive to the price of the good, this is illustrated by a
a. demand curve that is relatively flat (more horizontal). b. demand curve that is relatively steep (more vertical). c. supply curve that is relatively flat (more horizontal). d. supply curve that is relatively steep (more vertical).