The figures below illustrate a situation of a trade embargo. In Figure (a) Dd and Sd are the domestic demand and supply curves of the embargoing countries. Prior to the embargo there was free trade at the world price of P0.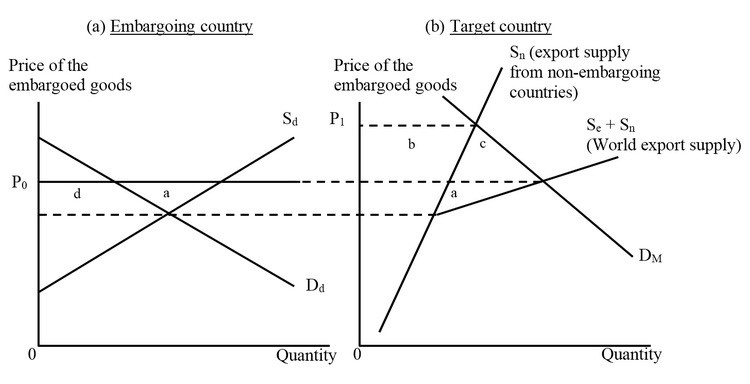 The embargoing country loses area ________ while the target country loses area.
A. (b + c); (a + c).
B. a; b.
C. (a + d); (b + c).
D. a; (b + c).
Answer: D
You might also like to view...
Suppose there are 11 buyers and 11 sellers, each willing to buy or sell one unit of a good, with values {$14, $13, $12, $11, $10, $9, $8, $7, $6, $5, $4,}. Assume no transaction costs and a competitive market. Now suppose competition among several market makers forces the spread down to $4 . How many goods are traded?
a. Four b. Five c. Six d. Seven
Output per person on a country level is another way to think about:
A. real GDP per capita. B. nominal GDP. C. productivity. D. GDP growth rates.
Because money __________________, people are _________________ likely to specialize in their work in a money economy
A) is a store of value; less B) eliminates the double coincidence of wants; more C) is a unit of account; more D) eliminates the need for holdings of precious metals; more
Explain what caused the supply curve to shift more than the demand curve for HD televisions.
What will be an ideal response?