The bar graph shows the number of students who flunk Dr. Jones' class each year.  During which year(s) did exactly 6 students flunk Dr. Jones' class?
A. 1995, 2004
B. 2004
C. 1994
D. 1994, 2004
Answer: D
Mathematics
You might also like to view...
The scores on a 30-point multiple-choice exam are given in the following frequency table:
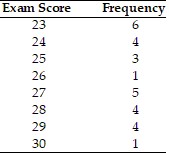 The range on the exam is
A. 10. B. 7. C. 9. D. 8. E. none of these
Mathematics
Without graphing the function, determine its amplitude or period as requested.y = 4 sin xFind the amplitude.
A. 4?
B. 4
C. 2?
D. 
Mathematics
Write the complex number in polar form. Express the argument in radians.5 - 5i
A. 5

B. 5
C. 5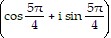
D. 5

Mathematics
Solve the equation. =
= 
A. 13 B. -1 C. 1 D. -13
Mathematics