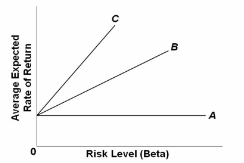
Refer to the graph. Which of the three Security Market Lines depicts the situation where investors most dislike risk?
A. Line A.
B. Line B.
C. Line C.
D. It cannot be determined from the graph.
C. Line C.
You might also like to view...
Graph the MSB and MSC functions on the same diagram. Show the regionally-based set of standards (ALA and AREMAINDER) that should be recommended to achieve allocative efficiency in each region. Find the numerical value of each standard.
Los Angeles County has the worst urban air quality across all major metropolitan areas in the United States. Automobile emissions contribute significantly to this problem. Assume the California Air Resources Board is consideringwhether to set a uniform emission standard or a regionally-based emission standard, where one standard is set for Los Angeles County and another for the rest of the state. Marginal social benefits (MSB) and marginal social costs (MSC) for the two regions have been estimated as follows: MSBabatement in LA County = 500 ?0.75A MSBabatement in the rest of California = 150 ? 0.25A MSCabatementin all of California = 0.5A, where A is the level of abatement of automobile emissions, and MSB and MSC are in millions of dollars.
Deadweight loss is the decrease in ________ from producing an inefficient amount of a product
A) only consumer surplus B) only producer surplus C) consumer surplus and producer surplus D) profit
Health care reform will lead to a(n) ____ in the number of new, young health care recipients which will cause the ____ of moral hazard problems associated with health insurance
a. increase; elimination b. increase; worsening c. decrease; elimination d. decrease; worsening
Market power may result from
A. Antitrust policy. B. Flawed price signals. C. Control of resources. D. Merit goods.